What is Z-score?
Contents [show]
Definition: Z-score, sometimes called standard score, is a measurement of how many standard deviations a point is away from the mean of its data set. To be more specific it is a measurement of the number of standard deviations a data point is above or below the mean population.
This statistical measurement is used to compare data points from different data sets to find correlations. Z score can be zero, positive or negative. If the score is zero, it indicates that the score is identical to the mean. In other words, it point is average. Positive values represent how far above the mean a point is on the distribution curve. Negative values represent how far below the mean a point is on the distribution curve.
What is AZ-Score?
This concept was adapted to the business and finance world by Dr. Edward Altman who used it predict the likelihood that a company would go bankrupt. His calculation called the Altman Z-score, sums several weighted financial ratios and compares it to a graded scale. The lower the score, the more likely the company is to declare bankruptcy.
Let’s look at how to calculate Z-score in an example.
Formula
The Z-score formula is calculated by subtracting the total score from mean and then dividing it by standard deviation.

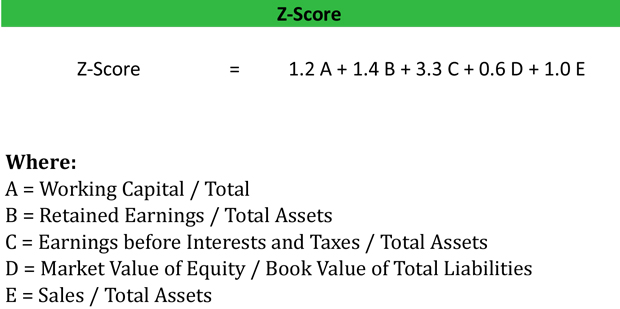
The Altman Z-score equation is calculated by weighting various financial ratios and comparing their sum to a graded scale. The equation looks like this:

As you can see, the Altman score weights different profitability and liquidity metrics to arrive at the overall score. This overall score is then compared to the following grading scale.
- 0 – 1.8 indicates the company will declare bankruptcy in the future.
- 1.8 – 3 indicates the company is likely to declare bankruptcy.
- 3+ indicates the company is will not declare bankruptcy.
Let’s take a look at an example.
Example
First, let’s start with a statistical example. Let’s assume that the mean score for a class of 50 students is 60 and the standard deviation is 15 marks. A student named Emily asked the teacher if by scoring 70 she has performed well or not. Initially by looking at Emily’s score, it appears that she did well considering that 60 is the mean class score.
However, this doesn’t reflect the variation among 50 students. Considering the standard deviation of 15, it is very likely that there is a significant variation among the scores. To answer the question how well Emily performed in the coursework compared to other students in the class we can use the Z score.

For finding out the number of students in the class that scored higher or lower than Emily, we will look at the normal distribution table. In this case the Z-value comes to 0.2514. It means that the probability of a score being higher than 0.67 is 25.14%. It shows that approximately 25% of all the students scored higher than Emily.
Coming back to the question, we can clearly see that Emily performed better than 74.86% of the students in her class.
Now let’s turn to a financial example.
Let’s assume Bill’s Boats’ financial statements had the following figures:
- Sales: $1M
- EBIT: $500,000
- Total Assets: $2M
- Book Value of Total Liabilities: $1M
- Retained Earnings: $1M
- Market Value of Equity: $3M
- Working Capital: $500,000
Bill’s Altman score would be calculated like this:
Score = 1.2(.25) + 1.4(.5) + 3.3(.25) + 0.6(3) + 1.0(.5)
Score = (.3 + .7 + .825 + 1.8 + .5) = 4.125
- A = $500,000/ $2,000,000
- B = $1,000,000 / $2,000,000
- C = $500,000 / $2,000,000
- D = $3,000,000 / $1,000,000
- E = $1,000,000 / $2,000,000
Bill’s Boats’ score is 4.125. This means that the company isn’t close to insolvency. Bill is doing well with a score well above the 3+ rating. This means that investors and creditors shouldn’t be too worried about the company according to this metric. Instead, they should look to other indicators to get a full picture of Bill’s business.
Analysis
The ZScore is an important measure in determining the financial strength of a company since it relies on several different metrics. Many investors use it to gauge the solvency of a company and decide whether to buy or sell an investment. The lower Z score indicates that a firm is gradually approaching insolvency or bankruptcy. Thus, firms with lower scores are higher risk investments.
Keep in mind that this calculation doesn’t work for new companies because their earnings are too low. The low earnings negatively affect most of the ratios used in the Altman score calculation. Thus, new companies tend to always have a low Altman score.
Additionally, the Z score formula doesn’t reflect cash flows. For example, a highly profitable company with poor cash flow might not be able to pay its liabilities and as a result will have to declare bankruptcy.
It is an important point to note that Z scores are not calculated for the purpose of estimating when a company will file bankruptcy, but rather it helps in measuring how close a company resembles other companies that have become insolvent. The model is widely criticized over the years as it utilizes unexplained accounting data. Despite these criticisms, Z-score is still the one of the most widely used measures of a company’s financial health.


