What is the Correlation Coefficient?
Contents [show]
Definition: The correlation coefficient, also commonly known as Pearson correlation, is a statistical measure of the dependence or association of two numbers. When two sets of numbers move in the same direction at the same time, they are said to have a positive correlation. When one series of numbers moves up as the other moves down, they are said to have a negative correlation. This will result in a negative correlation coefficient.
The correlation coefficient is applied to finance and economics to track and better understand data. While data trends and statistical analysis often go untracked by small businesses; investment banks, financial services companies, and even the federal reserve of the United States use the correlation coefficient to help track historical data in hopes that it can help to better predict and determine market trends.
In the aftermath of the 2008 financial crisis, the Federal Reserve lowered interest rates in an effort to stimulate the economy. This lowering of rates also lowered the unemployment rate. This shows that the Fed’s interest rate and the unemployment rate for the U.S. have a positive correlation coefficient.
Let’s take a look at how to calculate the correlation coefficient.
Formula
The correlation coefficient formula is longer than most professionals want to calculate, so they typically use data sources that already give the output, or a mathematical calculator that can quickly deliver the correlation output when the data is given. This can also be programed into an Excel spreadsheet.

Once correlation coefficient is a number from -1 to 1, or any number in-between. If two data sets move in lock step in the same direction and by the same amount, they have a correlation coefficient of 1. If they move by the exact same amount but in the opposite direction, the number would be -1.
If the two sets of data seem to have no relationship at all, they have a correlation of 0. In the above example where the Federal Reserve lowered interest rates, and the unemployment rate also lowered somewhat. The two numbers had a positive correlation (correlation coefficient greater than 0). But because they did not move the same amount, the number would be less than 1.
Let’s take a look at an example.
Example
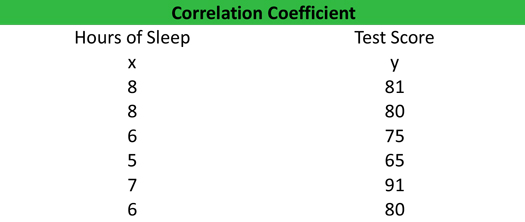
Yvonne is a good student, but at times she doesn’t get enough sleep. She hypothesizes that when she gets more sleep she does better on tests. To test her hypothesis, she tracked how she did on a number of tests, based on how many hours of sleep she got on the night previous. She inputs the following data into her excel file to compute the correlation coefficient equation.

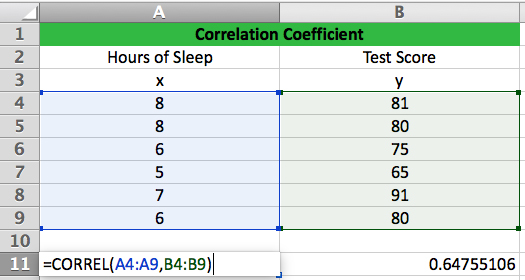
She uses the correlation formula “(CORRELL) within excel and enters her data sets as seen below. 0.65 is the formulas output. Sure enough! Yvonne was right, her hours of sleep gotten the night before a test and her test scores are positively correlated.

The output of 0.65 means that when the number of hours slept increases so does the test score. Had the two numbers been perfectly correlated (both increased by the same percentage) then the correlation coefficient would have been exactly 1.
Let’s suppose Yvonne posed her question a different way. If she thought “I bet I would miss less questions on my tests if only I got more sleep.” And then tracked the number of missed questions (a decreasing number) instead of the test score (an increasing number) she would surely find that the increase in the hours slept before the test equates to less questions missed, and therefore the two data sets would have a NEGATIVE correlation.
If your goal were to have a direct increase or decrease on an outcome, then a correlation coefficient closer to -1 or 1 would be desirable. The closer to 0 the correlation coefficient is, the weaker the results. For instance, if Yvonne wanted to see how the number of hours slept effected how tall she was when she woke up the next morning, she would surely find that there is no correlation, and the correlation coefficient would be 0.
If a small business owner were to record and keep great data on his business the way Yvonne did on her sleep habits, he would be able to calculate and track the cause and effect or the correlation coefficient of many aspects in his business.
If a restaurant owner had come under scrutiny for health safety concerns, he would be able to track the results of more frequent kitchen cleanings by using tracking the number of cleanings and the number of reports of food poisoning. Ideally he would see a decrease in the number of food poisoning cases as the number of kitchen cleanings was increased. If this were the case, it would be a textbook example of a negative correlation coefficient. When one set of data increased, the other decreased.
Analysis and Interpretation
Correlation coefficient is most often used in the analysis of public companies or asset classes. If an investment banking analyst were to research investments that go up in value over time (appreciate) but wanted to also find an investment that did not have a strong correlation with the stock market, correlation coefficient would certainly be one of the criteria that would be taken into account. This way the investor could diversify his or her investments and not have all his eggs in one basket dependent on the market.
Portfolio 1 is the U.S. Stock market, which by no surprise moves in perfect lock step with itself, giving it a correlation coefficient of exactly 1.00 (bottom right image)
Portfolio 2 is Gold, a precious metal that has gone up in value just like the stock market has, but has not gone up at the same time as the market, as a matter of fact, the two asset classes don’t seem to have much effect on the other moving up or down. This gives is a very low correlation coefficient, 0.05 to be exact.
Portfolio 3 is a long-term government bond, they seem to move in the opposite direction as the stock market, but that is a generalization and is not true all the time. As you can see, its correlation coefficient with the market is -0.30.
Practical Usage Explanation: Cautions and Limitations
The correlation coefficient is a powerful analysis tool, but it should also be used with other metrics and not in a vacuum. It’s also important to keep in mind this analysis is simply a tool to track past performance. Based on the past performance, analysts can make predictions, but they are not always accurate as the market changes unpredictably.
Be cautious of making decisions purely based on this data. Use it along with other information and data to have a better understanding of the entire industry and market.


