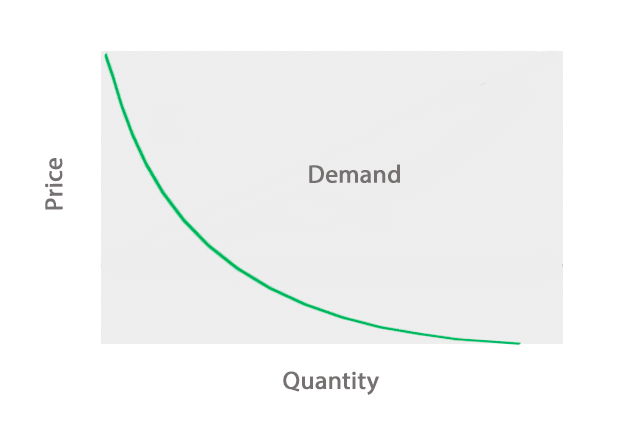
Definition: The market demand curve is a graph that shows the quantity of goods that consumers are willing and able to purchase a certain prices.
What Does Market Demand Curve Mean?
Contents [show]
What is the definition of market demand curve? This curve shows how much goods and services all consumers in an economy are willing and able to purchase at a certain price. It’s important to note that this graph does not depict the amount of goods consumers merely want or desire. It shows what they will actually purchase if they have the means to do so. There are many different factors that determine the demand for a product like consumer purchasing power, preference, and confidence.
The total market demand shows the big picture of all competitors in a market. This helps management consider price changes and determine production volumes to make.
As you can see, the curve is downward sloping. This indicates that as the price of a good increases, the demand for the good decreases. In other words, as products get more expensive, consumers are less willing and able to buy them.

Let’s look at an example.
Example
The total market for passenger vehicles in a particular country is made up of three models, A, B and C. Model A is a basic vehicle with no extras. This particular vehicle is used by lower income groups. There is a huge demand for this vehicle at lower prices. At higher prices the demand drops off quickly.
Model B is in middle of the range vehicle with a few extras, Consumers buying this vehicle requires a basic and reliable vehicle. This vehicle is not available at low prices but the range is uniform.
Model C is a luxury model and is expensive. The demand for these vehicles is limited to upper income earners and price is not really a concern for these buyers.
From the above it can be seen that the market for vehicles in the lower price class is elastic. These buyers are very sensitive to higher prices. A small increase in price will cause a large decrease in demand. Similarly segment C is inelastic as buyers of the expensive vehicles are not as sensitive when prices rise. A small change in price will cause only a small change in demand. The differences in elasticity can be seen from the slope of the various target market demand curves.
Summary Definition
Define Market Demand Curve: Market demand curve means graph that plots the amount of goods consumers are willing and able to purchase at different prices.


