Definition: The estimated line of cost behavior is line drawn on a scatter diagram to show the relationship between cost and sales or units produced. In other words, it’s a line drawn through the average costs on a scatter plot diagram to show how total costs increase as production or sales increase.
What Does Estimated Line of Cost Behavior Mean?
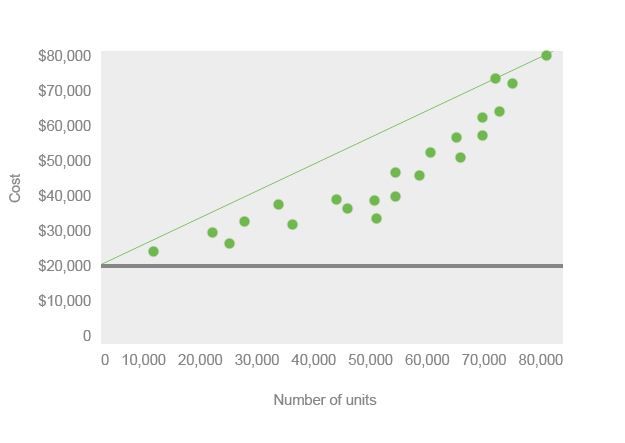
On most accounting scatter diagrams, there is a horizontal line drawn to represent the fixed costs that will always be present no matter what the level of production is. These costs can be rent, insurance, or property taxes. All of these expenses will be present even if zero goods are produced. The estimated line of cost behavior starts on the y intercept at the point where fixed costs start. This shows that total costs equal the variable costs plus the fixed costs.
Example
As you can see, the variable costs increase as the production process increases. Thus, the estimated cost behavior line increases at the same rate as the variable cost line. In order to draw this line, you’ll have to calculate the slope or rate of increase in the variable costs as production is increased.
The slope formula can be calculated by dividing the change in cost by the change in sale or units. The denominator can change depending on what your scatter diagram is measuring. After you have calculated the slope, you can put on dot on the y intercept where the fixed costs line crosses and the other dot on the slope coordinate you calculated. Connect the two dots and you have the estimated line of cost behavior.

Here is an example of what a scatter diagram looks like.

This diagram uses the high low method to estimate the cost line. Management often uses the estimated costs line to predict future expenses based on expected production levels.


