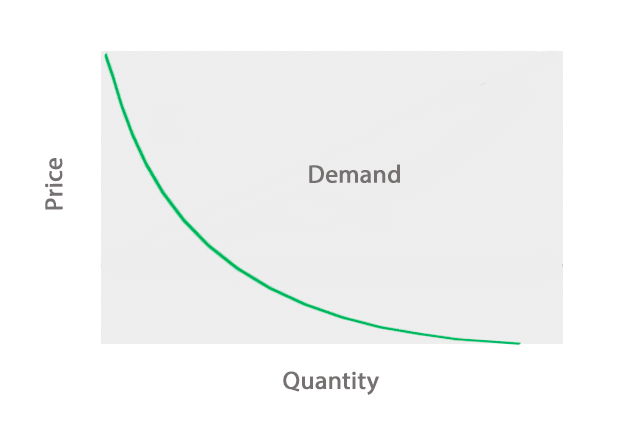
Definition: The demand curve is a downward sloping economic graph that shows the relationship between quantity of product demanded by a market and the price the market is willing to pay. Quantity Demanded is always graphed horizontally on the x-axis while Price is graphed vertically on the y-axis.
What Does Demand Curve Mean?
Contents [show]
The curve demonstrates the Law of Demand, which states that as prices for a product increase, the quantity demanded by consumers decreases. In other words, as the product becomes more expensive, less consumers will want or be able to purchase it. The opposite is true for decreasing prices.

Let’s look at an example.
Example
Let’s take Apple computer for example. In the 1980s there was an increasing demand for personal computers in business and home use. Apple had several successful computer lines and decided to release the Lisa in 1983. It was extremely expensive. As such, the demand for this product was very low because consumers weren’t willing to pay that much for a personal computer at the time. If Apple could have lowered the price on the Lisa, the demand would have increased and the product would have sold better.
As you can see, demand and price have an inverse correlation. As price increase, demand decreases because consumers are unwilling or unable to pay for the product.
This is even true if someone truly desires a good or service, but they can’t afford it. A good example of this is a rare medicine or treatment for an illness. If you can’t afford the treatment, you can’t purchase it no matter how much you demand it.
Low prices affect demand in the opposite way. A low price might encourage you to buy to or try something you ordinarily wouldn’t be interested in. Like if you also eat name brand cereal then one day you noticed a sale for the generic brand, you may purchase the generic cereal because the cost is so low.
The concept of demand plays a large role in our everyday lives and the goods and services we consume.


